Understand your CiteHawk dashboard
What every card on the overview measures, where the numbers come from, and what changes when a new collection lands.
About 10 minutes · 7 steps
Open your workspace overview
Your workspace opens on the overview. Every number on it comes from stored AI answers: real buyer questions put to the AI models, with the receipts kept. Nothing is modelled or estimated.
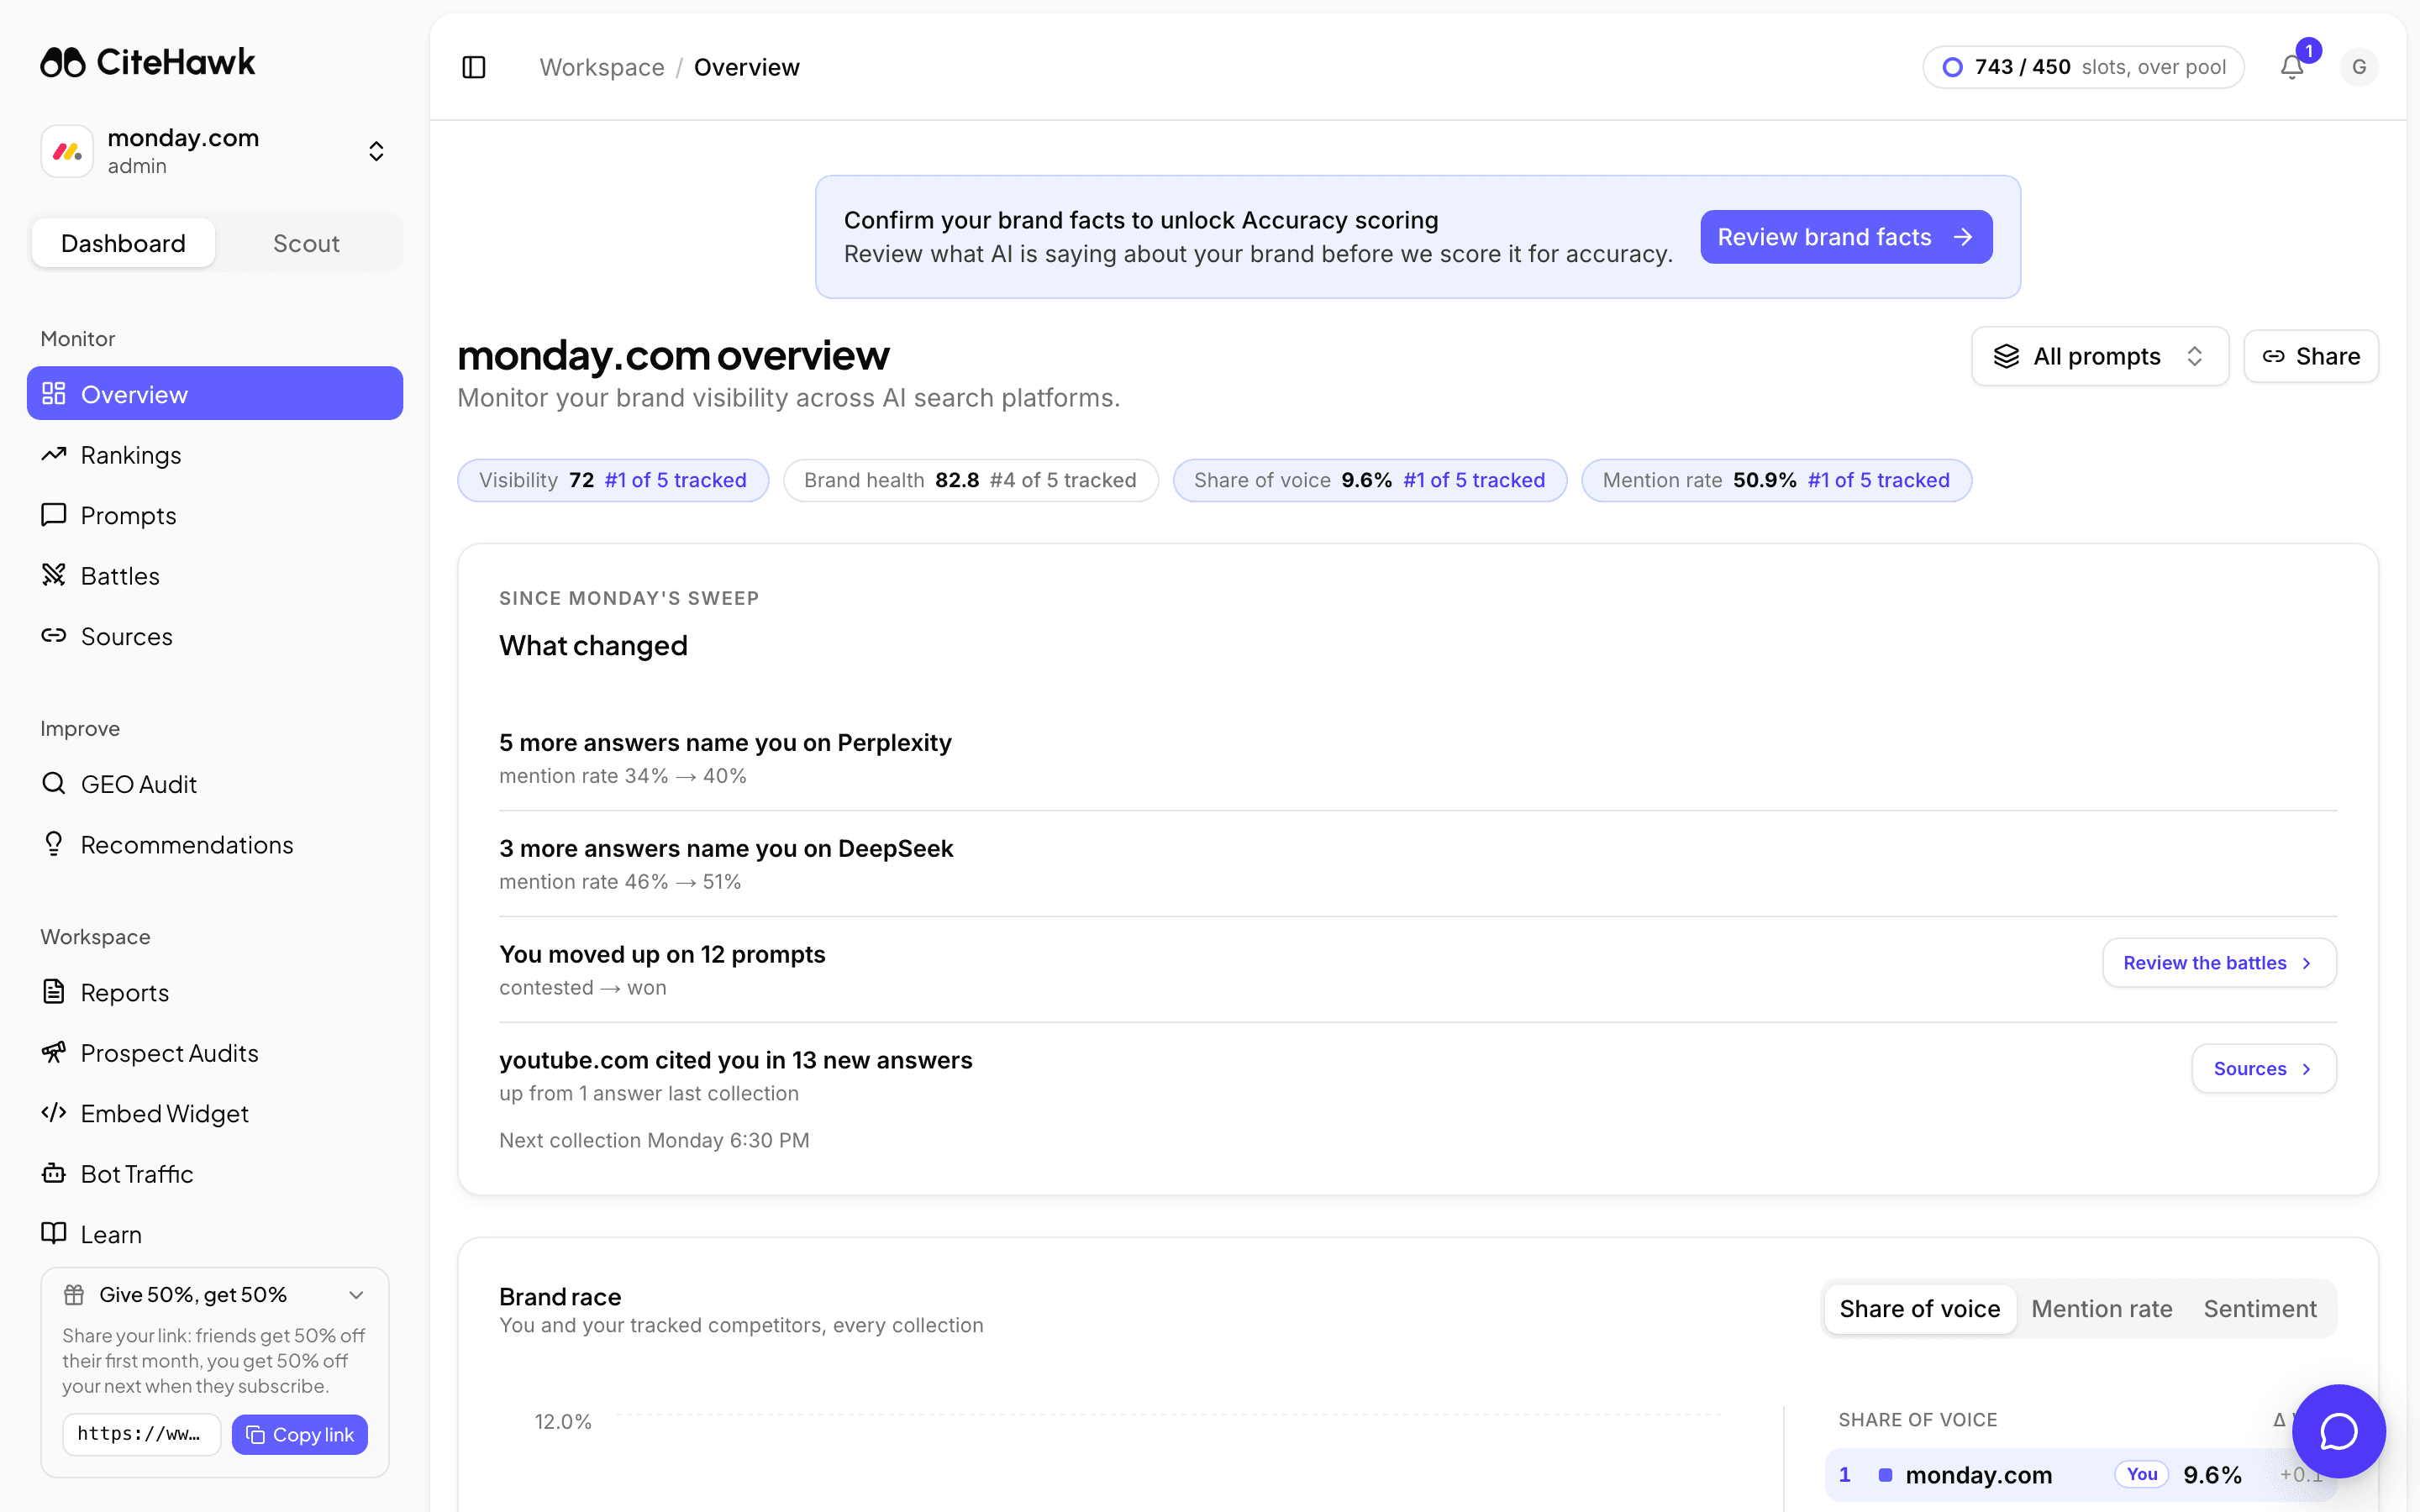
Read your two scores
Visibility blends presence, how often AI models name you in discovery answers, with authority, how often they cite your site as the source, into one number out of 100. Brand health scores the tone and accuracy of what AI says when it talks about you. Each card shows your movement since last week and where you rank against your competitor set.
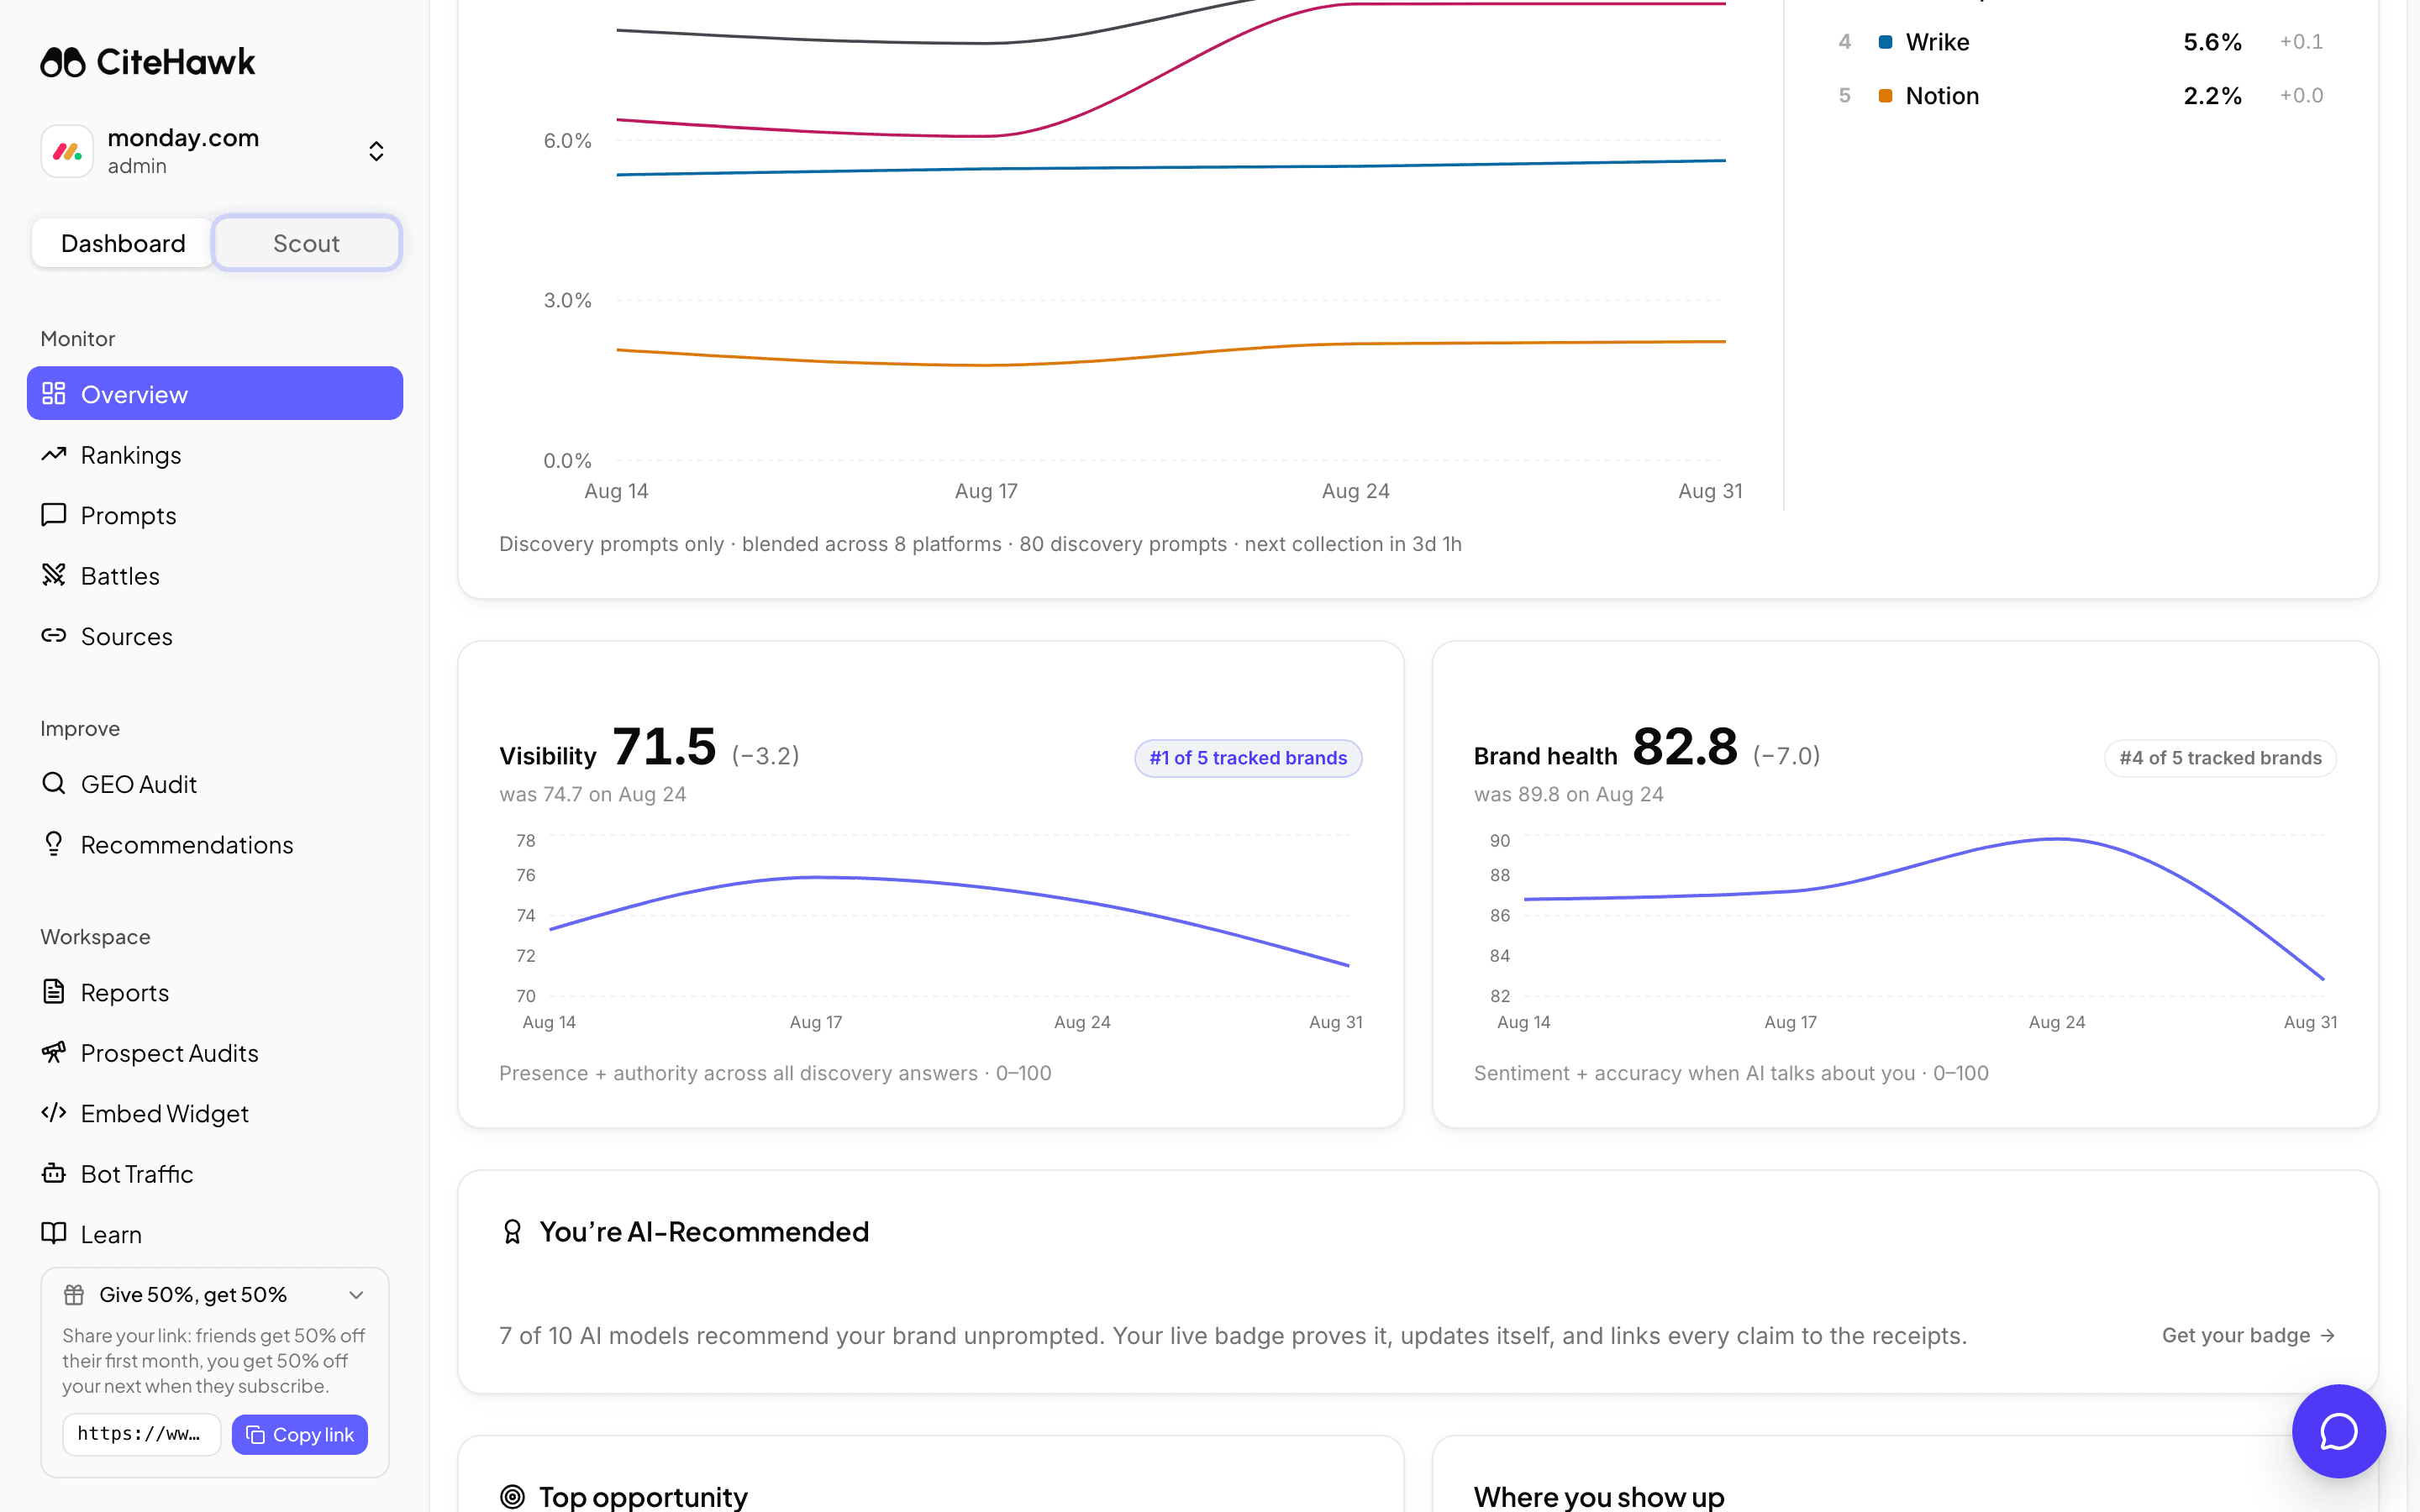
Follow the brand race
The brand race plots you and every tracked competitor on each collection, using discovery questions only: the ones that never name any brand. The standings on the right are live from your latest collection; the chart itself starts drawing once your second collection lands.
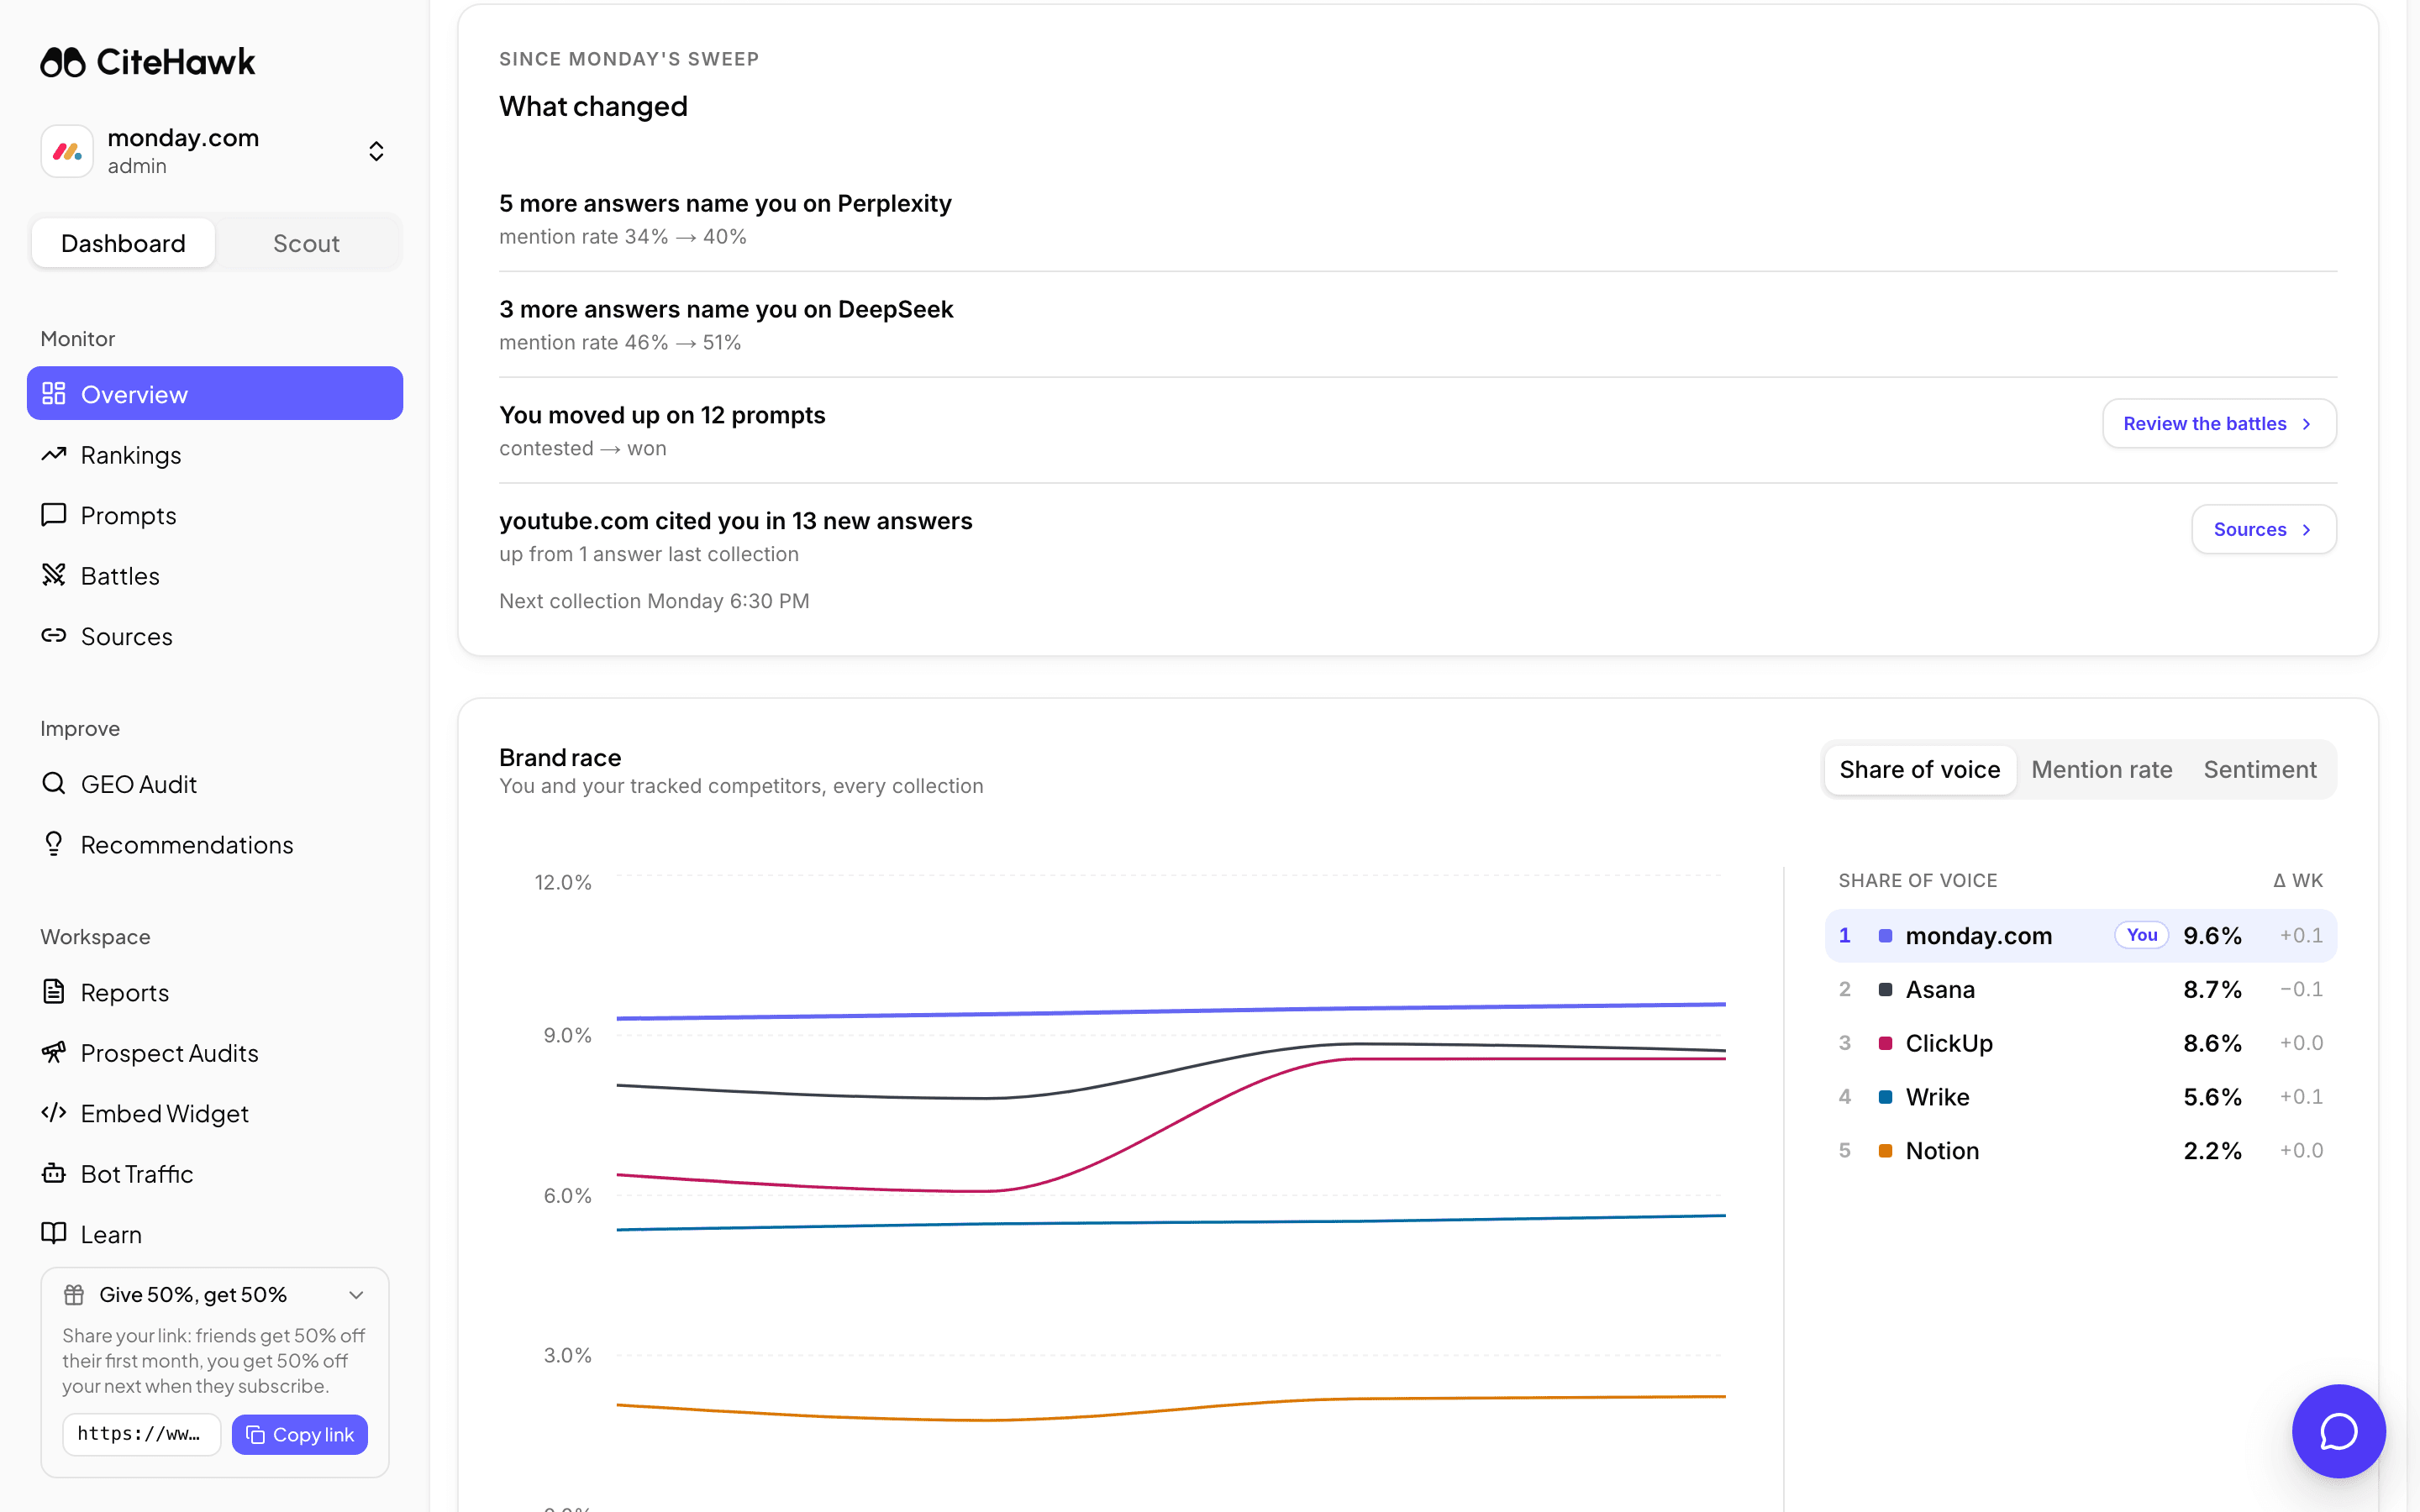
See where you show up
Where you show up breaks your mention rate down by AI model, so you can see which models already recommend you and which ones have never heard of you. The gaps here are usually the fastest wins: each model leans on different sources.
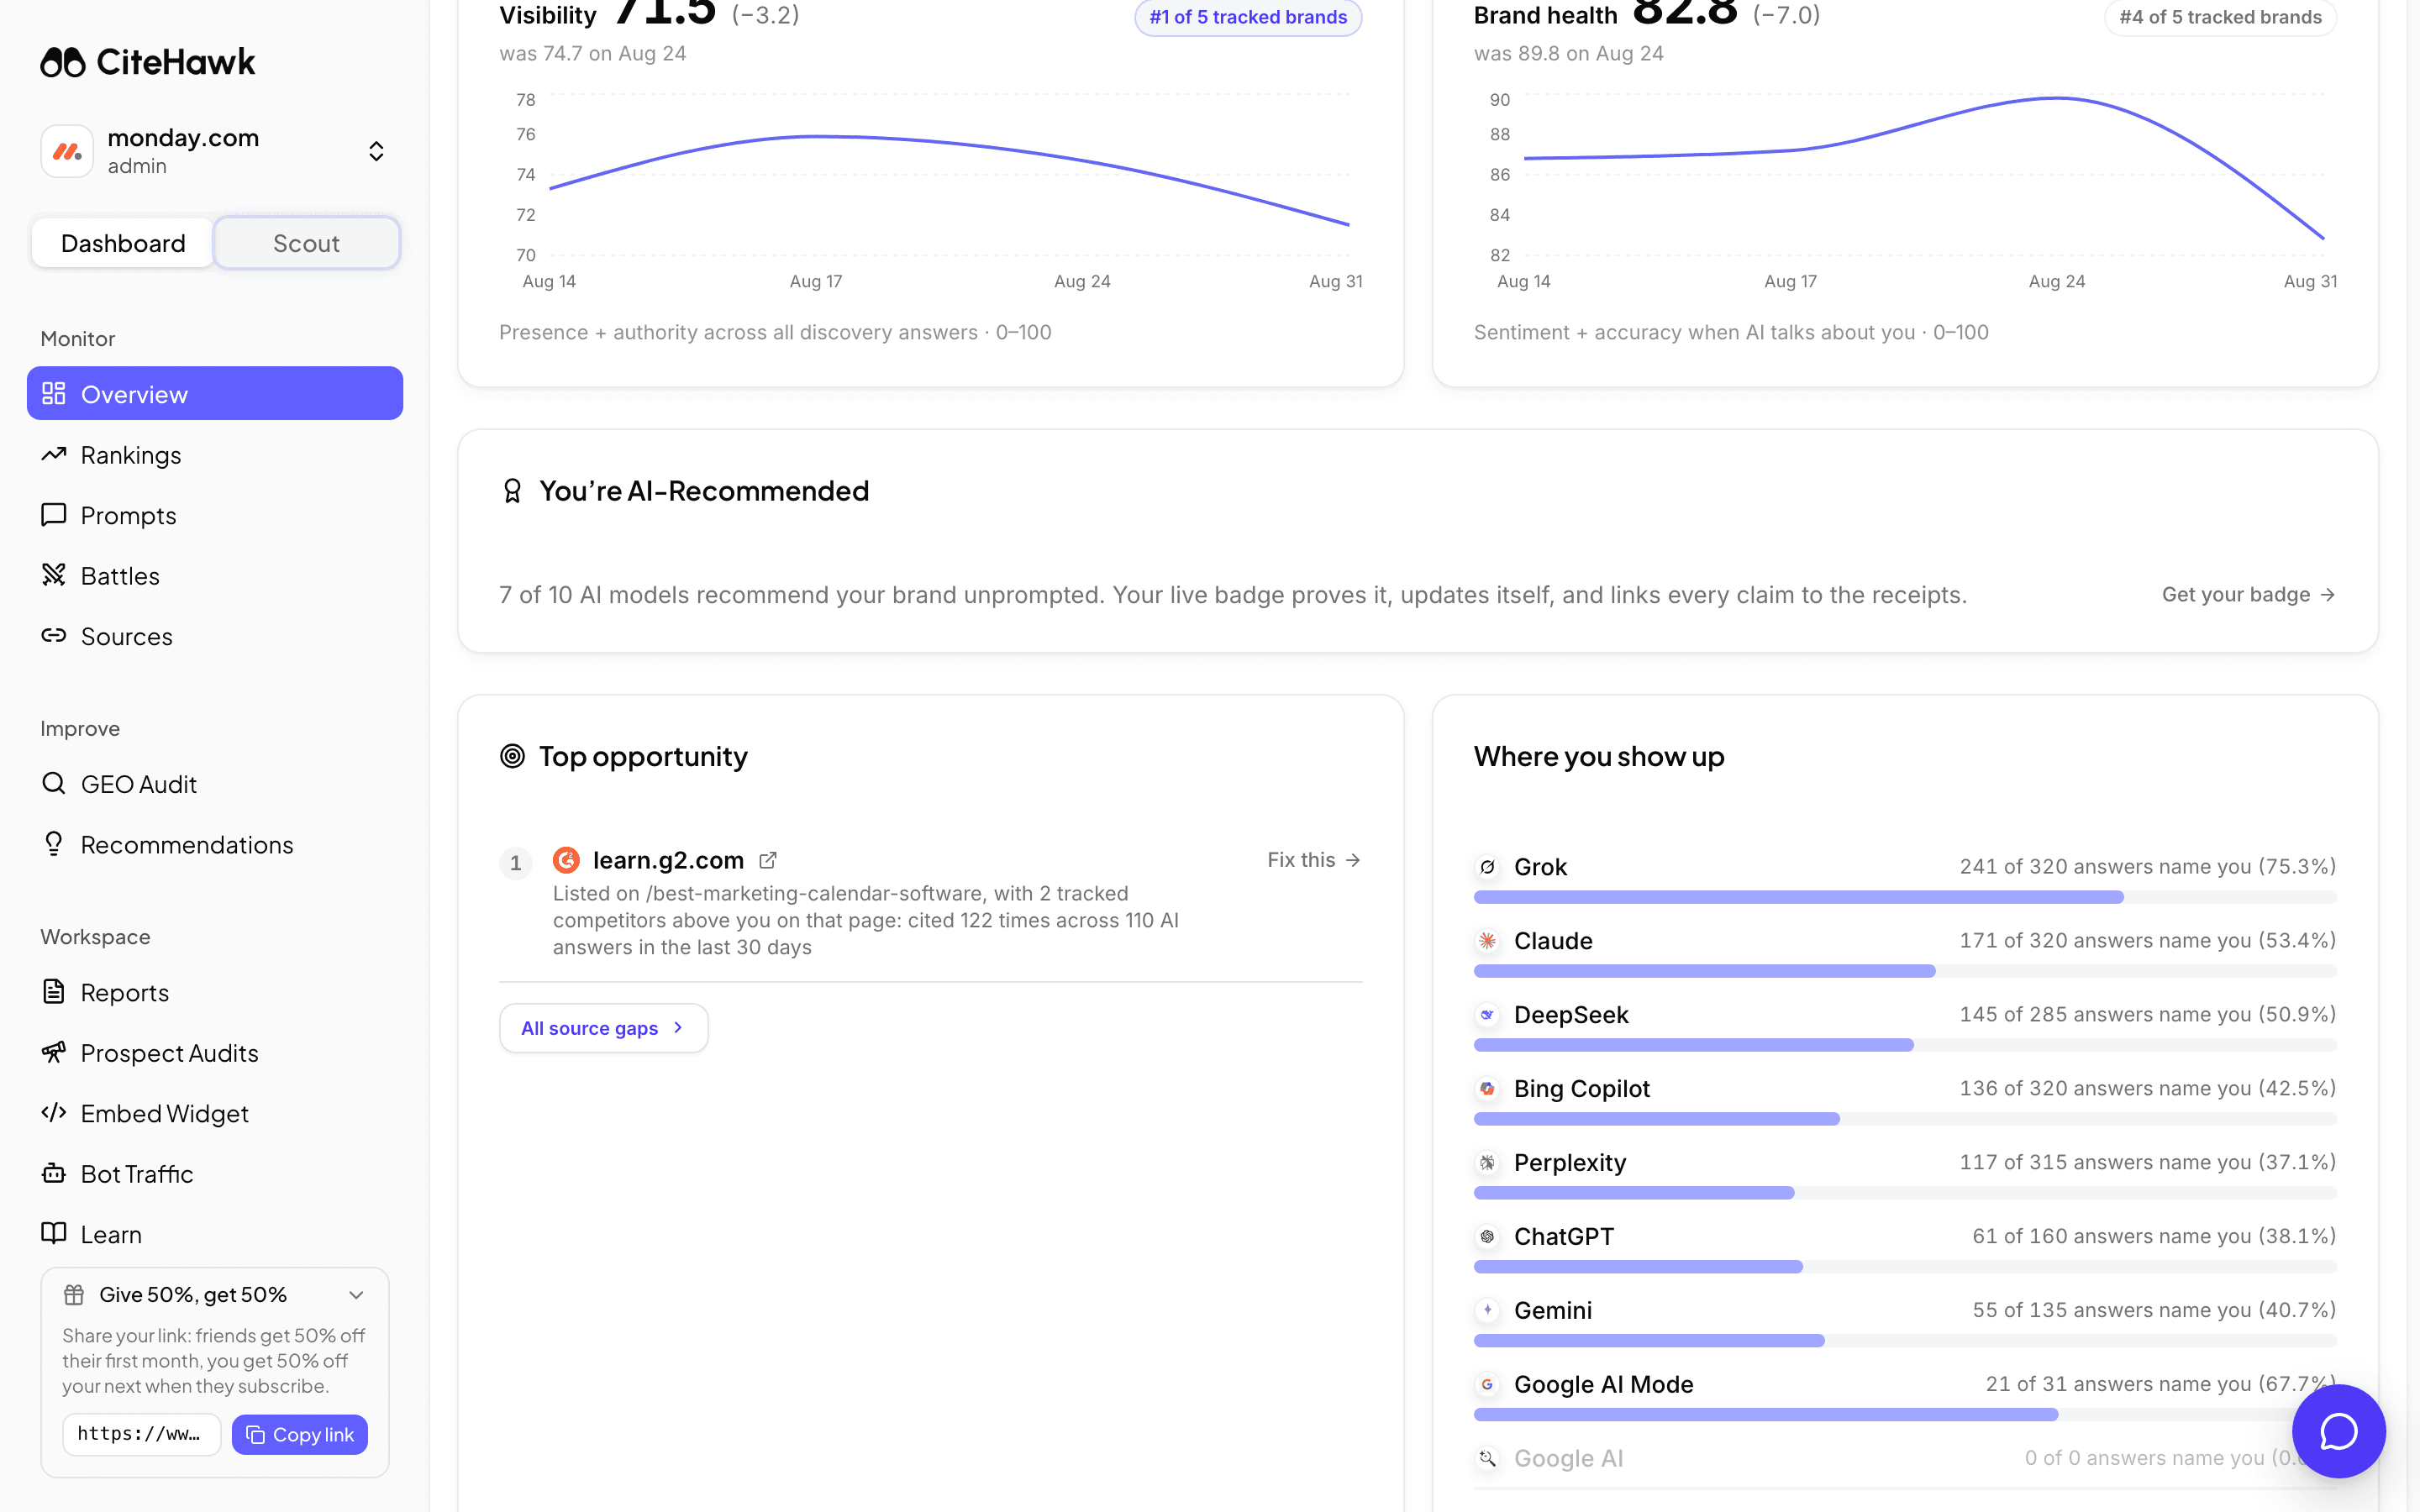
Read what AI actually says
What AI says about you collects the strongest recent quotes naming your brand, verbatim from stored answers. This is the ground truth behind every score above it, and the quickest way to hear your brand the way a buyer hears it.
Act on the top opportunity
Top opportunity surfaces the source gap most worth acting on: a page or listing the AI models cite for your category that you are missing from. The sidebar carries the deeper views: Rankings, Prompts, Battles and Sources under Monitor, and GEO Audit and Recommendations under Improve.
Know when the numbers change
On paid plans, a fresh collection runs every week and lands on Monday. From your second collection onward, the What changed card appears at the top of the overview and summarizes the movement since the last one, so a weekly glance starts there. Your first collection is the baseline, so there is nothing to compare it against yet. Free workspaces keep their first snapshot until they pick a plan.
You should see: On an active plan, the brand race caption counts down to your next collection.
If something doesn’t look right
The overview says "No data yet"
Your workspace has prompts but no completed collection. Follow the Go to Prompts button to review them; the overview fills in as soon as your first collection completes.
Cards I have read about are missing
Several cards only appear once earned or connected. You’re AI-Recommended appears when at least four AI models recommend you unprompted. The search comparison and AI-visitor panels need a Google Search Console or GA4 connection. The ad-value card needs a few weeks of history.
The brand race chart is empty
The chart needs two collections to draw a line. On a paid plan it appears after your second weekly run; on a free workspace it stays on the first snapshot until you pick a plan.
The numbers did not move this week
Collections land weekly on Mondays, so mid-week the overview shows the same collection you saw yesterday. What changed appears from your second collection and always names the collection it is comparing against.